Four charts which show how the West Midlands Mayoral election was won
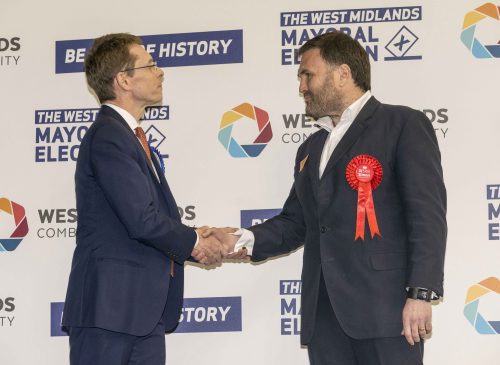
The first West Midlands Mayoral election was a close-run thing, with Conservative’s Andy Street claiming 50.4% to the 49.6% claimed by Labour’s Sion Simon after second preference votes were counted.
Here are four charts which show how the West Midlands Mayoral election was won…
1. Turnout in Solihull made the difference
Sion Simon won four of the seven local authority areas – Birmingham, Coventry, Sandwell and Wolverhampton – after the first and second preference counts.
But it was Solihull that won it for Street. He claimed 69% of the first preference votes which rose to 81% on the second preference.
Turnout in Solihull was 33.68%, far ahead of the second-best area, Birmingham, which achieved 28.55%.
If Solihull voters had turned out at the same level as the rest of the West Midlands, Street’s margin of victory in Solihull would have 6,763 votes lower.
His overall margin of victory was 3,739.
2. Just 1 in 384 non-voters could have changed the election
The first London mayoral election, in 2000, had a turnout of 34.4% but has twice reached 45.3%, in 2008 and 2016.
That gives some hope for future West Midlands mayoral elections, which are unlikely to be overshadowed by having a general election weeks later.
Turnout in the West Midlands was 26.68% of the 1.96m electorate. If Sion Simon could have persuaded just one out of every 384 non-voters to vote Labour, he would now be Mayor.
3. Voters didn’t understand – or didn’t care for – the second preference votes
The Mayoral election was decided on a second preference vote after no candidate received more than 50% support in the first round.
The Conservative’s Andy Street took a 6,021 lead over Labour’s Sion Simon, but the four elimated candidates had 89,385 votes to be reallocated.
However 47% of those votes either had no second preference or were for another of the eliminated candidates – perhaps surprising given that the election was expected to be close between Simon and Street in the second round. It suggests voters either didn’t understand or didn’t care about how the second preference votes worked.
4. The close race turned it into a two-horse race
Just 1 in 22 of the electorate cast a vote for someone other than Street or Simon.
Liberal Democrat Beverley Nielsen and Green Party candidate James Burn both ran campaigns that were well-received, but perhaps didn’t get the reward they deserved with voters sticking to the two main parties.
The four eliminated candidates, which also included UKIP’s Pete Durnell and Graham Stevenson from the Communist Party, received a total of 17.3%.
Nearly five out of six first round votes went to either Andy Street or Sion Simon. The remaining four candidates received 89,385 votes out of 523,201 votes cast – and out of an electorate of 1.96m.